Documentation
Data extraction
Documentation
Data extraction
Add column/dataitem to analysis
Columns (or dataitems) are organized per tab. See add tab.
To add a column, go to the “analysis” page. Click “data extraction”, open one of the tabs by clicking. Now click the white box with the “+” icon. Check the column(s) you want to add and click “Add selection”.
If the desired column is not available, click “Create new dataitem”. Fill out the name and type (columntypes) for the new column and click “Add new dataitem”.
Column settings
To configure a column, go to the “analysis” page. Click “data extraction”, open one of the tabs by clicking. Find the column and click on the “gear” icon.
For each column you can set whether you want the column to be extracted double blind and if you want a SD to SE and reverse calculator to show up. For RoB columns you can set a decision tree as image and add bias questions. For continuous outcomes you can configure the measures of central tendency and the measures of variability that are allowed to be extracted.
Column types
Each column has a type. The type helps you extract data in a handy format. The following types are currently present:
- zero-decimal (integer)
- two-decimal
- date
- single-select
- multi-select
- percentage
- small text
- bias
- daterange
- dichtomous outcome
- continuous outcome
- big text
- frequency
- one-decimal
- dichtomous outcome (percentage)
- mean-median-value
- variability
Add tab to analysis
Each analysis can have multiple tabs. The “search strategy” and “screening” tab are always present. Other tabs can be added and removed at your own discretion.
To create a tab, go to the “analyses” page. Click “data extraction”, click on the grey box with the “+” icon. Check the tab(s) you want to add and click “Add selection”. If the desired tab is not available, click “Create new tab”. Give the tab a name and type (tabtypes) and click “Add new tab”.
Tab types
Each tab has a type, the type determines the structure of the tab. E.g., the “trial” tab has 1 row per study, but the “arms” tab can have as many rows per study as needed. The following tab types are available at the moment:
- per study
- per publication
- per arm per study
- per subgroup per study
- bias per outcome per study
- per subgroup per arm
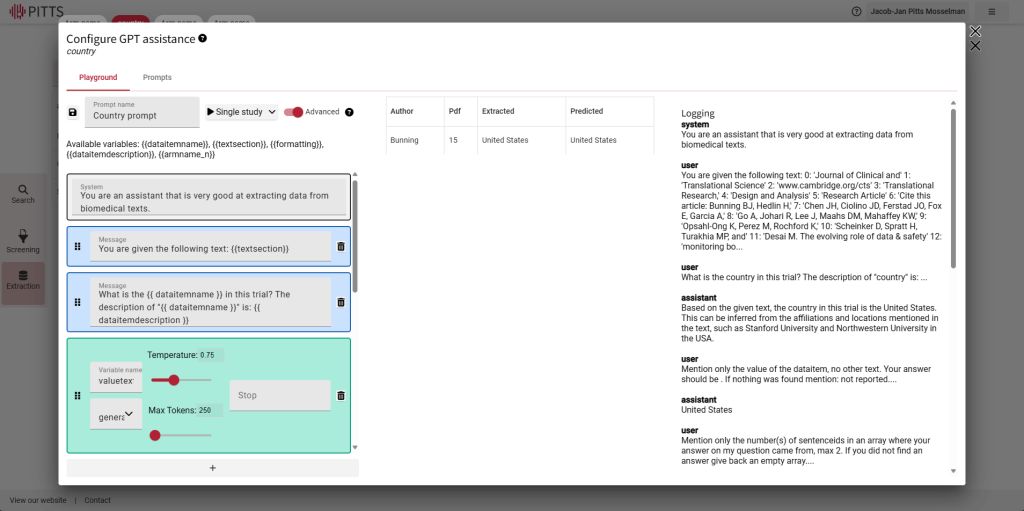
Configure GPT
The blue boxes talk to GPT, in the green ones GPT generates answers.
For the green boxes: there needs to be at least one with the variable name ‘value’ and one with ‘sentences’.
Temperature determines the randomness of the answer and max tokens the length of it.
In the logs you can see the questions you asked and the answers GPT generated.